
The CBTA matrix calculation is based on the average deviation from a preset norm, which you define when creating the CBTA program.
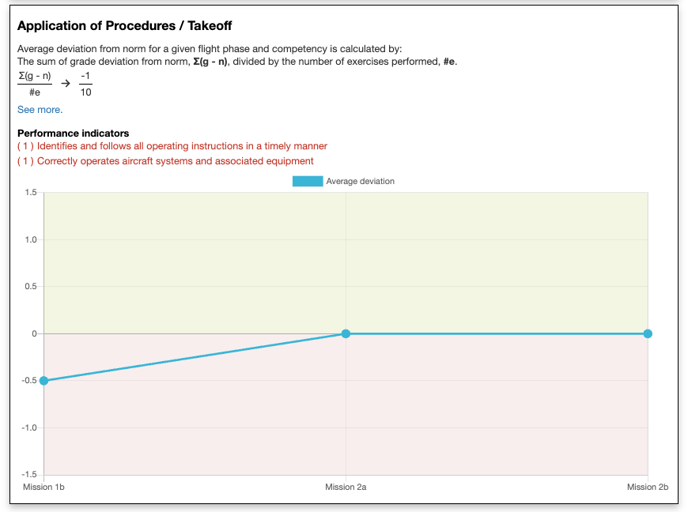
The average deviation from the norm for a given flight phase and competency is calculated by:
The sum of grade deviation from the norm, Σ(g - n), is divided by the number of exercises performed, #e.
The color-coded ranges configured for the heat map matrix are shown below. Colors can be customized under Administration -> Programs.
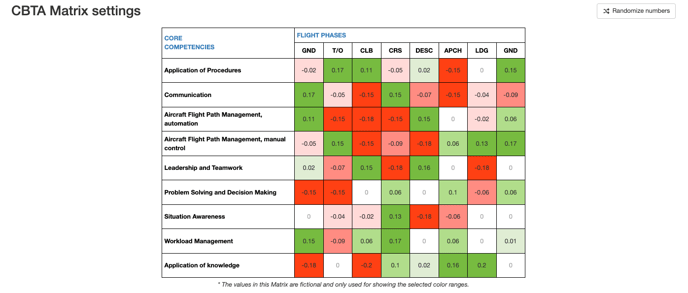
The screenshot below shows the fraction calculation alongside the color thresholds that trigger each color. You can configure as many color ranges as needed — for example, a simple red/white/green scheme — or define a completely custom palette. The configuration is fully flexible and determined by your organization.
The value displayed to instructors and students is shown as a fraction, not a decimal.
The numerator represents the average deviation from the norm, and the denominator represents the number of exercises the calculation is based on.
An example is shown below.
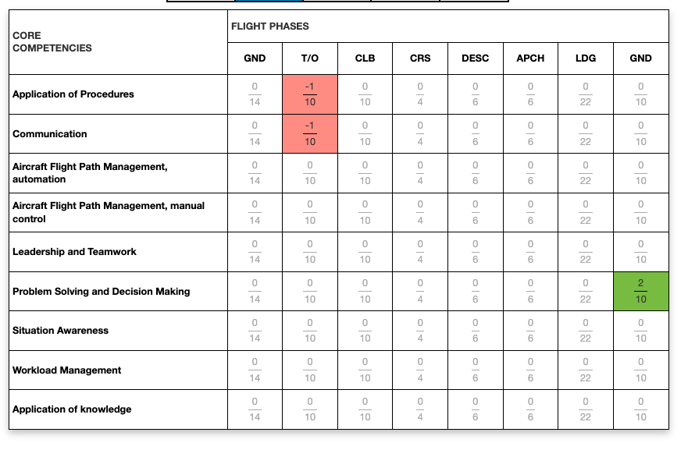
Clicking on a cell value — for example, -1/10 — opens a detailed view showing the performance indicators assessed by the previous instructor and the specific areas where the student deviated from the norm.
The following video explains how values in the CBTA matrix are calculated (begins at 2:07).