What Are Statistic Groups?
Statistic Groups are a key feature in FlightLogger, designed to help monitor and analyze student performance in a structured way.
They act as categories or clusters that group related exercises together, typically those that focus on a specific flight skill or training objective.
For example, all exercises involving approach procedures (like "Final Approach", "Missed Approach", or "Stabilized Approach") might be grouped under a single Statistic Group called “Approach”.
By grouping exercises this way:
- Instructors can track how students are progressing in specific skill areas over time.
- Administrators gain better insights across different lessons, programs, and revisions.
- Students benefit from consistent evaluation and feedback across similar types of training activities.
Statistic Groups ensure that performance data is not scattered across similar but separately named exercises. Instead, it’s centralized, making it easier to analyze trends, identify weak spots, and improve instructional quality.
Statistic Groups are created directly within the Master Exercise List and play a crucial role in tying everything together across your training programs, from revisions, phases, lessons to exercises.
Understanding Statistic Groups
Once instructors begin grading exercises, those results are logged into their associated Statistic Groups.
This allows FlightLogger to visualize student performance clearly, making it easier for instructors and admins to spot trends, identify problem areas, and support progress.
So, it all starts with maintaining a well-structured Master Exercise List. Once exercises are grouped correctly, the system takes care of the rest, calculating and presenting performance data in a way that's simple and easy to understand.
Instructor & Student Workflow with the Master Exercise List
Imagine a student is enrolled in a Private Pilot License (PPL) program.
The instructor clicks "Proceed" on a booked lesson and enters the student profile page, where the booked lesson are listed in blue.
These lessons, with their respective exercises, are set up in advance by an administrator under Administration → Programs, using the Master Exercise List.
During grading, each exercise shows the student’s Highest Grade (HG) in this specific phase, giving instructors a quick overview of how the student has performed on that same exercise in the past.
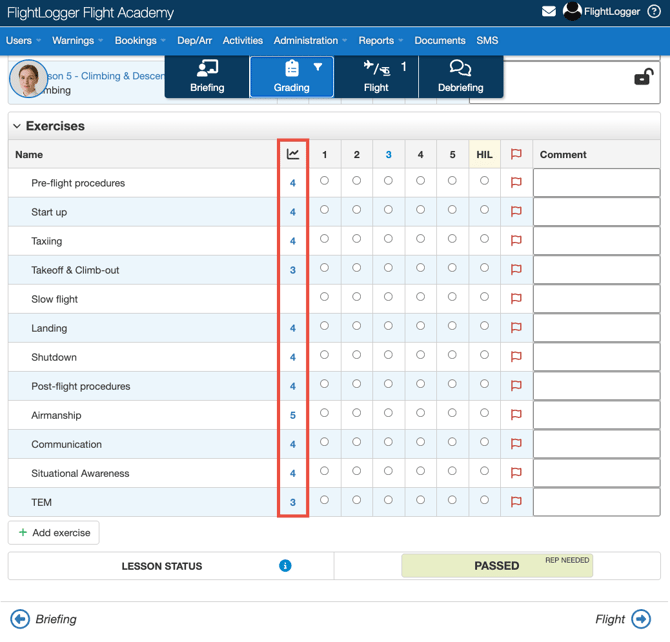
By clicking the HG value, instructors can view a performance graph, which shows two different graphs.
The yellow graph shows the average score over time, in this specific phase.
The blue graph shows the specific score for the exercise, organized into lessons, for the statistic group “Pre-flight procedures.”
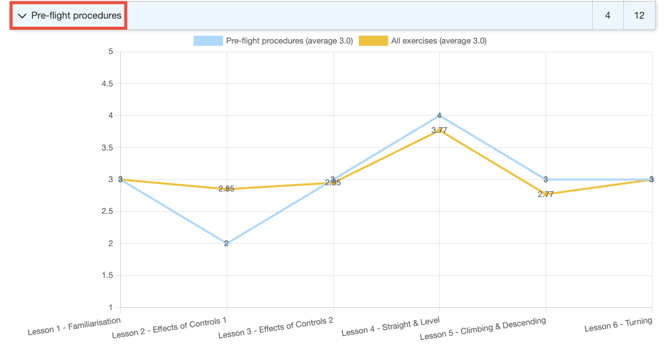
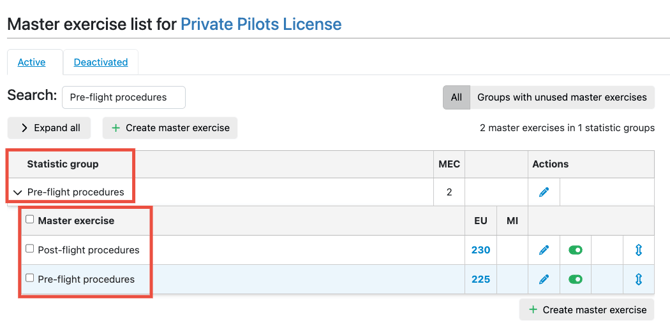
You can find this group (Pre-flight procedures) in the Master Exercise List, and it includes all master exercises that belong to this category.
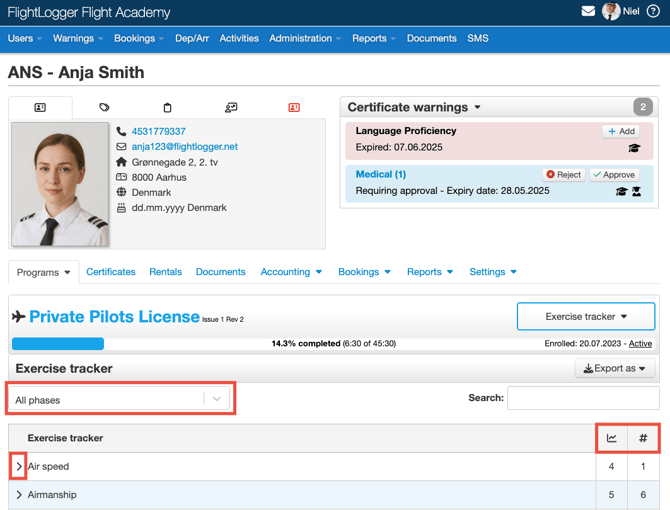
Progress can also be tracked from the Student Profile.
Open the Progress tab and go to the Exercise Tracker.
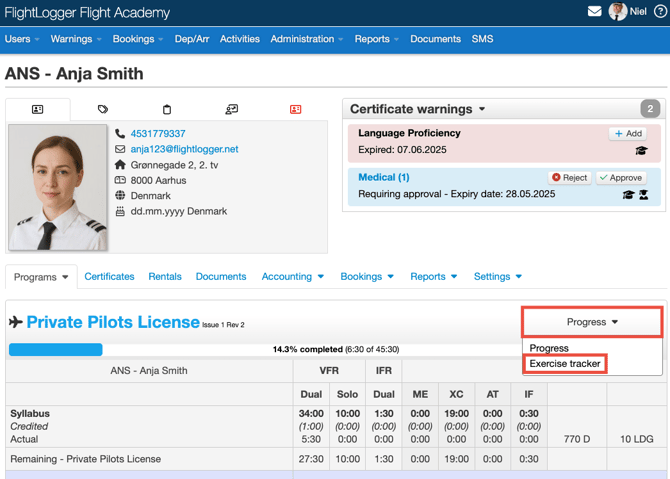
Here, you will see all statistic groups for each phase, with the option to filter by phase.
-
The hash key icon (#) shows how many times a statistic group has been graded.
-
The graph icon shows the highest grade (HG score from the grade slip) achieved so far.
- Click the arrow next to a statistic group name to open its detailed graph view.
Other Functions
The connection between the Master Exercise List and the Lesson View also makes other functions possible.
When an instructor opens a lesson, it is linked directly to the Master Exercise List and its Statistic Groups.
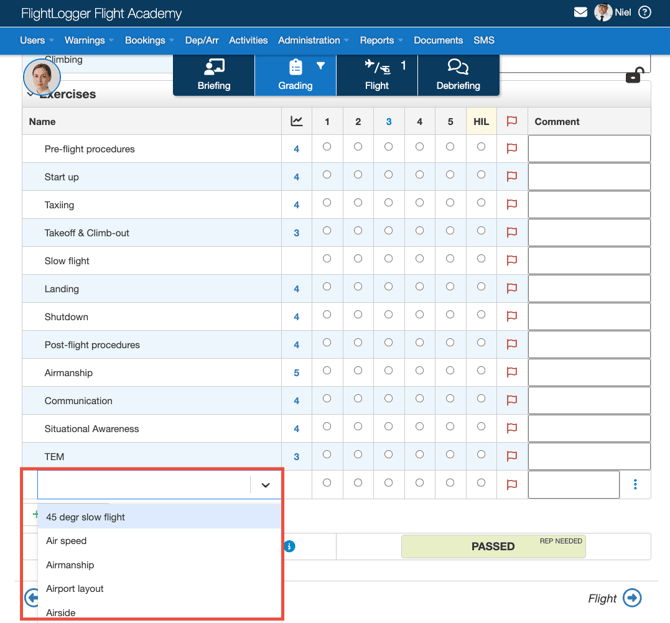
This gives the possibility for instructors to add extra exercises in two ways:
- Create exercises manually: These exercises are not part of the Master Exercise List, so they won’t be tracked centrally.
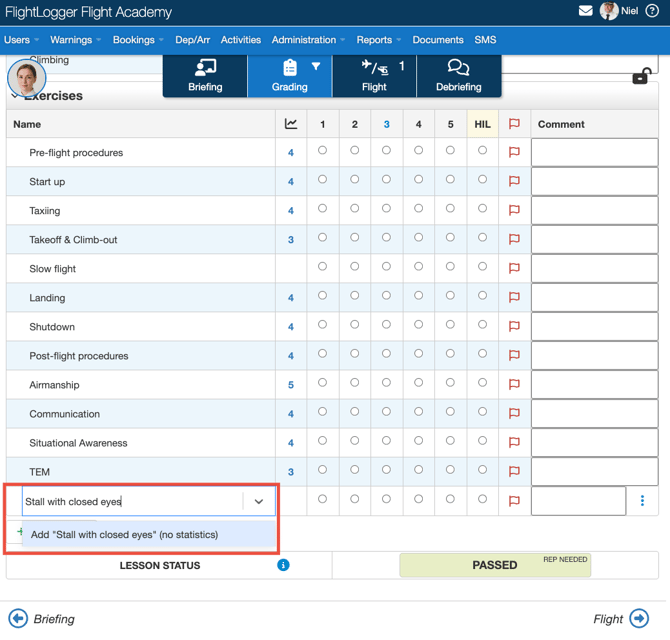
- Select exercises from the drop-down list: This list is connected to the Master Exercise List, and any exercises added this way will be tracked.
Need help?
If you need assistance creating or structuring your training programs, feel free to contact our support team via the Get Support button inside FlightLogger